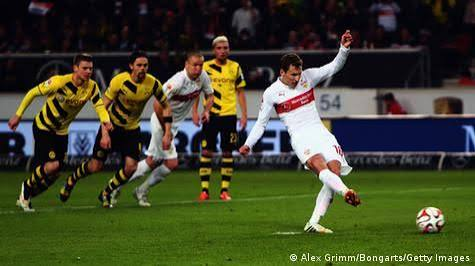

The 2014/2015 Bundesliga campaign remains a fascinating case study for football analysts and tactical enthusiasts alike. Beyond the standard metrics of goals scored and points accrued, the nuances of set-piece generation—specifically corner kicks—highlighted the stark stylistic contrasts between Germany’s top-tier clubs. For individuals evaluating the historical data to build predictive models or refine their statistical approaches, understanding which teams consistently drove match totals above or below the market line requires looking deeper than mere averages. By dissecting the underlying tactical philosophies, offensive structures, and defensive tendencies of that specific season, we can uncover the structural drivers that made certain teams perfect candidates for high or low corner outcomes.
Why Style of Play Dictates Set-Piece Frequency
The total number of corners in any given football match is rarely a product of random chance; instead, it serves as a direct reflection of how two opposing tactical systems clash on the pitch. During the 2014/2015 German top-flight season, teams that prioritized rapid vertical transitions and heavy wing utilization naturally forced opponents into conceding deflections along the goal line. Conversely, sides that favored low-block defensive structures or strict central possession rarely saw their matches reach double-digit corner figures.
When a team consistently aims to isolate its wingers in 1v1 situations near the penalty box, the mathematical probability of crossing attempts being blocked behind the goal line escalates dramatically. This relationship between intentional width and set-piece creation forms the foundation of modern statistical analysis in sports forecasting.
The High-Volume Outliers: Teams Engineered for the Over Market
Pep Guardiola’s dominant Bayern Munich side during the 2014/2015 campaign serves as the quintessential example of a system designed to maximize corner counts. By pinning opposition defensive lines deep into their own eighteen-yard box and utilizing world-class wingers like Arjen Robben and Franck Ribéry, Bayern forced a relentless barrage of clearances and deflections.
However, they were not the only team driving high numbers. Teams like Bayer Leverkusen, under Roger Schmidt’s aggressive, high-pressing regime, generated immense chaotic volume in the final third. The sheer speed of their transitions frequently resulted in hurried defensive interventions, creating a high-frequency environment for set-piece situations at both ends of the pitch.
Dissecting the Tactical Mechanics of Corner Generation
To accurately forecast whether a match will exceed the standard betting line, analysts must isolate the specific on-field behaviors that trigger goal-line deflections. It is not merely about a team being good at attacking; it is about how they construct their offensive phases.
Wing Trajectories and Low Crosses
Teams that rely heavily on traditional wingers who look to beat their fullback to the byline before cutting the ball back across the face of the goal are statistically bound to win more corners. In the 2014/2015 season, teams utilizing this method frequently saw low, hard crosses intercepted by sliding center-backs, instantly sending the ball out of play. This mechanical sequence systematically elevates the total count over ninety minutes.
Centralized Possession and Distance Shooting
In contrast, teams that build their attacks through intricate, short passing combinations in the central corridors of the pitch generate far fewer corner kicks. When an offensive strategy relies on penetrating the box through the middle or settling for speculative long-range strikes, defensive units are more likely to block shots forward into the midfield or watch the ball sail over the crossbar, completely bypassing the corner flag.
The Low-Volume Outliers: Identifying the Under Candidates
On the opposite end of the spectrum, the 2014/2015 Bundesliga season featured several clubs whose matches were highly profitable for low-total projections. Lower-tier sides such as SC Paderborn or FC Köln often deployed compact, narrow defensive shapes designed to protect the central box at all costs while offering very little outward attacking ambition on the road.
When two conservative teams faced one another, the lack of adventurous wing play combined with slow, deliberate build-up phases resulted in stagnant matches. These games rarely featured the frantic, end-to-end sequences necessary to accumulate a high volume of set-pieces, making them ideal targets for historical under-market trends.
Game State Variables and Their Impact on Historical Data
A critical element that raw season-long statistics often obscure is the profound impact of the game state—specifically, which team is leading or trailing at any given moment. In 2014/2015, when a high-caliber side like VfL Wolfsburg found themselves trailing at halftime, their subsequent tactical shift involved overloading the flanks and committing extra bodies forward, which caused their second-half corner production to spike significantly.
Conversely, if a dominant team ข้อดีufabet an early two-goal cushion, they frequently shifted into a passive possession cycle, killing the game’s tempo and grinding set-piece generation to a complete halt. Recognizing these situational shifts is paramount for live match analysis.
Evaluating Market Lines Against Real-World Probabilities
Successfully capitalizing on corner statistics requires a sharp understanding of how oddsmakers price these markets relative to actual on-field performance. Many recreational analytical approaches fail because they rely solely on the combined seasonal average of two teams, neglecting the reality that bookmakers adjust lines based on public perception and recent goalscoring trends.
Historical data from the 2014/2015 season reveals that public bias consistently pushed corner lines higher for prominent teams, creating substantial value for contrarian approaches. When sharp analytical minds look to exploit these discrepancies, they rely on comprehensive digital sportsbooks that offer deeply granular proposition markets. Modern analysts tracking historical league trends often seek out a reliable sports betting service to cross-reference past statistical thresholds against contemporary live odds variations. By studying how the 2014/2015 Bundesliga lines shifted in response to injuries or tactical adjustments, researchers can better anticipate how modern platforms price similar matchups today.
The Danger of Relying Solely on Seasonal Averages
One of the most frequent missteps in statistical sports analysis is the blind application of seasonal means without accounting for variance and distributional skew. A team might finish the 2014/2015 season with an average of 5.5 corners per game, but a closer look at the data might reveal that this average was heavily inflated by two or three anomalous performances where they racked up fifteen or sixteen corners against relegated opposition.
If the team recorded four or fewer corners in the majority of their remaining fixtures, relying on the raw mean would lead to highly flawed projections. Calculating the median and analyzing consistency rates across different opposition tiers yields a much more accurate representation of a team’s true probability distribution.
Integrating League Trends into Broader Analytical Frameworks
Studying historical data from specific eras like the mid-2010s Bundesliga provides the necessary foundation for evaluating broader patterns across global football leagues. The German top flight during this period was characterized by its shift toward intense counter-pressing, a tactical evolution that fundamentally altered how space was defended and how set-pieces were conceded.
For enthusiasts who enjoy applying these structural insights across various sports entertainment mediums, understanding statistical variance is an invaluable skill. Those who possess a deep comprehension of statistical probabilities often find that these exact same principles of risk assessment, variance management, and pattern recognition translate seamlessly when exploring the diverse gaming suites offered by a premium casino online website. Ultimately, whether analyzing the probability of a short-corner routine in an elite European league or calculating the volatility of a digital matrix, success hinges entirely on separating sustainable structural trends from temporary noise.
Summary
Analyzing the corner kick metrics of the 2014/2015 Bundesliga season demonstrates that set-piece frequency is a direct byproduct of tactical intent rather than random distribution. High-volume outcomes were consistently driven by teams employing aggressive wing play, high-tempo transitions, and suffocating attacking pressure, exemplified by Bayern Munich and Bayer Leverkusen. Conversely, low-volume outcomes were dictated by narrow defensive structures, slow build-up play, and conservative tactical approaches from lower-table clubs. By moving past basic seasonal averages and accounting for game-state variables, variance, and systemic styles of play, analysts can accurately identify which historical profiles truly suited the over or under corner markets.